

AUDIO DE-EMPHASIS RESPONSE TABLE
PRE/DE-EMPHASIS IN FM MODULATED TRANSMISSION SYSTEMS:
BY: Frank McClatchie
FM SYSTEMS, INC.
PRE/DE-EMPHASIS IN FM MODULATED TRANSMISSION SYSTEMS:
In the transmission of FM modulation there is more noise at the higher audio frequencies than there is at the lower audio frequencies. To compensate for this unbalance and make the noise more uniform over the audio spectrum, the Broadcasting industry developed some standards for Pre-emphasis and matching De-emphasis. In a modulator the audio is boosted with Pre-emphasis prior to modulation. In the receiver, De-emphasis is used after demodulation to recover a flat audio frequency response. This results in a much improved Signal-to-Noise Ratio for any given FM transmission system.
The standard in the USA for FM Radio is 75 microseconds. BE aware that some countries have standardized on 25 or 50 microseconds and International Satellites use what is called the J-17 standard as well as others.
FREQUENCY RESPONSE TRANSMISSION LEVELS:
Note that all the losses shown on the De-emphasis tables would become gains for the Pre-emphasis network within any FM modulator. That means that FM modulators cannot be tested for frequency response at “test tone” transmission levels without overloading the transmitter bandwidth allocation. The best procedure when making a frequency response run is to make all such tests at an amplitude 20 dB lower than test-tone level. This will insure that FM modulation products remain within the frequency allocation bandwidth.
Over modulation during program audio conditions will not occur at standard modulation level with Pre-emphasis because the power content of music and voice drops rapidly above 2-3 KHz. Music may be transmitted at “test-tone” levels but sine-wave test tone frequencies cannot. The typical consequence of frequency response testing at “test-tone levels” is that an apparent “roll-off” in response is observed at about 6-7 KHz. Distortion of the sine wave also increases dramatically as the “roll-off” is encountered. Note that this is not a defect in the equipment, but an incorrect test procedure. Remember to drop the test level 20 dB when making frequency response tests on modulators and demodulators.
WHY USE “ROOFED” PRE-EMPHASIS:
The higher audio frequencies are boosted in the pre-emphasis network. Out-of-band RF signals entering with the audio program would also be boosted if they were not limited. Observe that an unlimited 75 microsecond pre-emphasis network would boost a 1 MHz spurious signal by 53.47 dB while the 26 dB “Roofed” 75 microsecond pre-emphasis network would only boost the spurious signal by 25.97 dB. Higher spurious signals would be boosted without limit in an unlimited pre-emphasis network while the “roofed” pre-emphasis network would limit at 26 dB.
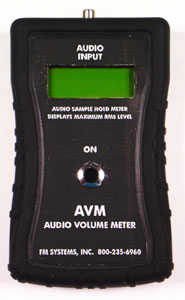
You can use the AVM Audio Volume Meter to measure audio level in dBm. It will measure test tones as well as live program levels and will store the maximum power or volume perceived by the ear. It is hand-held, portable and can be used to measure the response levels of different frequencies.
75 MICROSECOND RESPONSE TABLE:
UNLIMITED 26 dB 26 dB
FREQUENCY 75uS 75uS (roofed) 25uS (roofed)
50 Hz -0.00 dB -0.00 dB -0.00 dB
100 Hz -0.01 dB -0.01 dB -0.00 dB
500 Hz -0.23 dB -0.23 dB -0.03 dB
1 KHz -0.87 dB -0.87 dB -0.11 dB
2 KHz -2.76 dB -2.75 dB -0.41 dB
3 KHz -4.77 dB -4.75 dB -0.87 dB
4 KHz -6.58 dB -6.55 dB -1.44 dB
5 KHz -8.16 dB -8.11 dB -2.08 dB
6 KHz -9.54 dB -9.46 dB -2.75 dB
7 KHz -10.75 dB -10.64 dB -3.43 dB
8 KHz -11.82 dB -11.68 dB -4.10 dB
9 KHz -12.78 dB -12.60 dB -4.75 dB
10 KHz -13.66 dB -13.43 dB -5.37 dB
11 KHz -14.45 dB -14.17 dB -5.97 dB
12 KHz -15.18 dB -14.85 dB -6.54 dB
13 KHz -15.86 dB -15.47 dB -7.09 dB
14 KHz -16.49 dB -16.04 dB -7.61 dB
15 KHz -17.07 dB -16.56 dB -8.10 dB
16 KHz -17.62 dB -17.05 dB -8.58 dB
17 KHz -18.14 dB -17.50 dB -8.95 dB
18 KHz -18.63 dB -17.91 dB -9.45 dB
19 KHz -19.09 dB -18.30 dB -9.86 dB
20 KHz -19.53 dB -18.66 dB -10.26 dB
100 KHz -33.47 dB -25.27 dB -21.85 dB
1 MHz -53.47 dB -25.97 dB -25.95 dB
J-17 RESPONSE TABLE:
FREQUENCY J-17
1.00 Hz +9.38
50.00 Hz +9.32
200.00 Hz +8.68
400.00 Hz +7.10
800.00 Hz +3.72
1.42 KHz +0.00
2.00 KHz -2.40
4.00 KHz -6.28
6.40 KHz -7.89
8.00 KHz -8.37
10.00 KHz -8.70
100.00 KHz -9.38
If you need a meter to measure audio loudness, take a look at the AVM Audio Volume Meter.

CLICK HERE to get more information
